Read the statistical question
Start with the variables, the data display, the sampling method, and every prompt part before choosing a procedure.
Help your child connect data displays, sampling, probability, sampling distributions, inference, and regression to complete, defensible AP Statistics responses. A dedicated tutor supports classwork and AP exam preparation with live explanation, targeted practice, and conclusions stated clearly in context.

Today's focus
Data, inference, and clear conclusions
Check conditions and interpret in context.
Start with the variables, the data display, the sampling method, and every prompt part before choosing a procedure.
Decide between a proportion or a mean, an interval or a test, and the specific model the question calls for.
Verify Random, 10%, and Large Counts or Normal conditions and show the calculator or formula work that supports them.
Turn a correct calculation into a full response by interpreting the interval or p-value for the real-world question.
What we support
Strong AP Statistics work is more than a recalled formula or a calculator output. Tutoring helps students read a data display, choose a justified procedure, check conditions, and interpret the result in context across classwork and AP-style practice.
How tutoring works
AP Statistics support is most useful when a student can move from the data, to the right procedure, to the conditions, to a conclusion in context. The tutoring process keeps that chain visible and repeatable from one unit to the next.
Review the current unit, an assignment, a quiz, or a released free-response question to decide whether the gap is a concept, a calculator procedure, checking conditions, or writing the interpretation.
Before computing, identify the variables and their type, the population or sample, the correct inference procedure, and the conditions that must be checked.
A tutor models one problem end to end — setup, calculator or formula work, and a conclusion in context — then guides fresh practice on a similar item.
Confirm the interval or test is stated with the parameter, the conditions, and a conclusion in context, because AP scoring rewards communication, not only a final number.
1-proportion z-interval
n = 200, p-hat = 0.60
A survey of 200 students finds 120 read daily. Build and interpret a 95% confidence interval for the true proportion.
Check
Random, 10%, Large Counts
Compute
p-hat +/- z*(SE)
Interpret
in context
Step 1
State the parameter
Step 2
Check the conditions
Step 3
Interpret in context
Tutor prompt
Interpret with care
"What does 95% confident actually mean for this interval?"
Response checklist
AP Statistics Tutoring
AP readiness workspace
Student learning hub
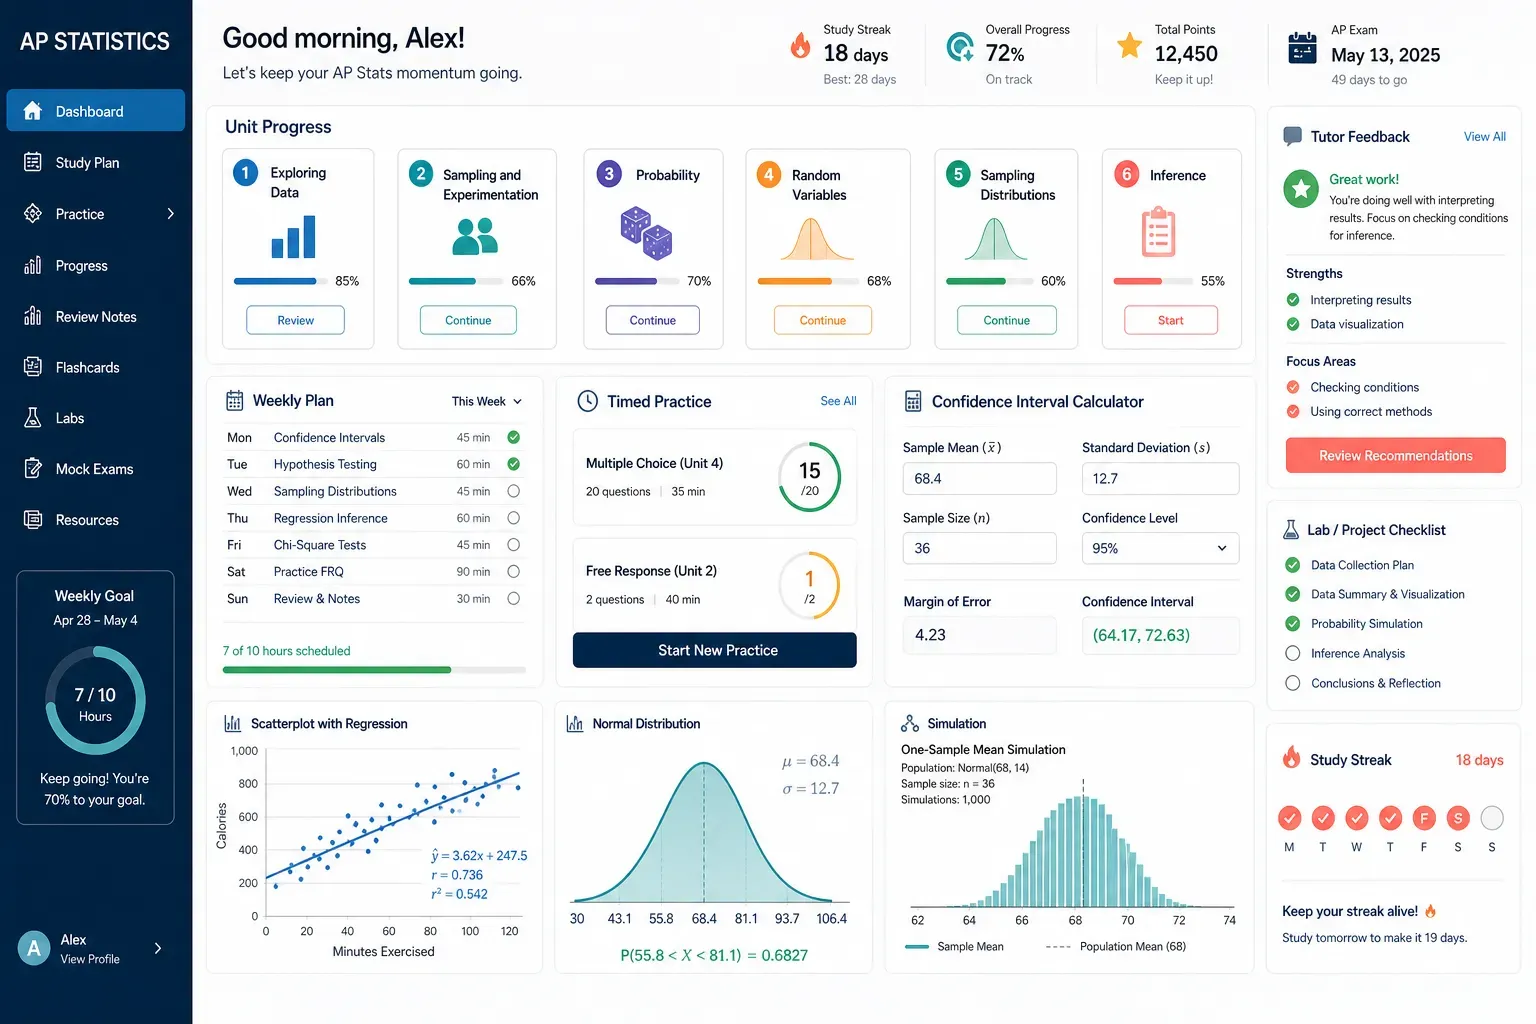
A useful learning hub makes the next practice target clear. Students can keep tutoring sessions, AP-style prompts, progress checks, study resources, and upcoming assessments connected to the same learning plan.
Keep the join link, lesson focus, current problem set, and upcoming AP Statistics session details ready before tutoring begins.
Keep one- and two-variable data, sampling, probability, distributions, inference, the formula sheet, and free-response reminders in one branded guide.
Organize free-response prompts, calculator steps, tutor feedback, and the next study target in one place.
Print structured AP Statistics practice with room to check conditions, show calculator work, and write a conclusion in context.
Bring classroom notes, the formula sheet, calculator steps, released free-response questions, and review material together in one focused workspace.
1-on-1 class interface
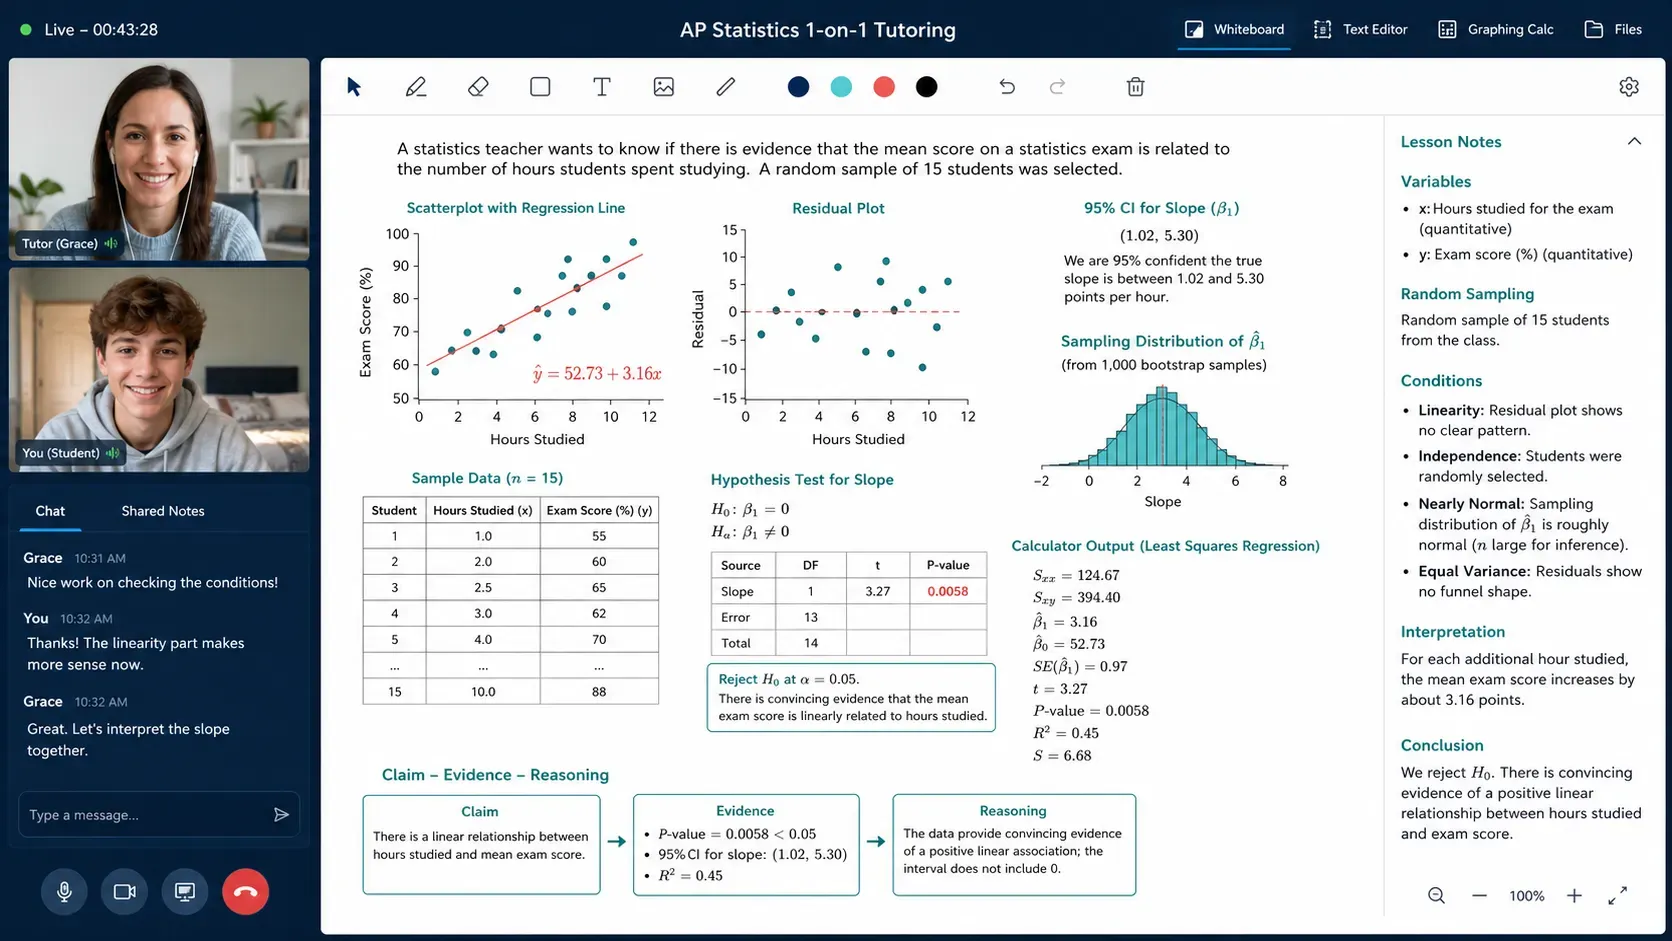
The shared class space makes the evidence visible: a tutor can annotate a graph, interpret a scatterplot, check conditions, read calculator output, and help the student turn a response outline into clear statistical reasoning.
A shared whiteboard keeps the data display, the statistical model, the calculator output, the conditions, and the written conclusion visible together while the tutor guides each decision.
Video-based 1-on-1 support lets the tutor hear how a student chose a procedure, checked a condition, or read output before refining the reasoning.
Focused notes, a conditions checklist, and a conclusion-in-context routine help students repeat a complete AP Statistics response on a new prompt.
AP Statistics exam planning
The AP Statistics exam has two equally weighted sections: multiple choice and free response. A graphing calculator with statistical capabilities is allowed on the whole exam, and College Board provides a formula sheet and statistical tables. The exam is given in May; confirm the exact date and whether your student sits a paper or digital exam directly with College Board.
Noble Educators is an independent tutoring provider and is not affiliated with or endorsed by College Board. Confirm the exam date, format, scoring, and accommodations directly with College Board.
40 questions | 1 hour 30 minutes | 50%. Questions span all nine units and reward reading data, choosing a procedure, and interpreting results. A graphing calculator is allowed.
6 questions | 1 hour 30 minutes | 50%. Five focused questions plus an Investigative Task that asks students to extend a concept and communicate clearly.
A graphing calculator with statistical capabilities is allowed throughout, and College Board provides a formula sheet and tables. Tutoring builds the steps and the reasoning behind them.
Both sections are weighted 50%, and the composite maps to the 1 to 5 AP score. Timed sets and released free-response questions turn each session into an actionable plan.
Official AP exam datesAP Statistics resources
These branded resources keep the nine AP Statistics units, the formula sheet, calculator strategy, and free-response review together. They are designed to support a tutoring session, independent review, or a conversation with a parent about the next study target.
Distributions, center and spread, the normal model, scatterplots, correlation, and least-squares regression.
Sampling methods and bias, observational studies, experiments, random assignment, and the scope of inference.
Probability rules, conditional probability, discrete and continuous random variables, and binomial and geometric models.
Sampling distributions, confidence intervals, and significance tests for proportions and means.
Goodness-of-fit and association tests, and inference for the slope of a regression line.
The formula sheet, the graphing calculator, the six free-response questions, the Investigative Task, and conclusions in context.
Five detailed pages for one- and two-variable data, sampling, probability, distributions, inference, and free-response strategy.
Open Review Guide PDFFive printable pages with practice across data, sampling, probability, inference, chi-square, and regression, with a full answer key.
Open Practice Worksheet PDFPricing comparison
Provider pricing and packages change, so families should confirm current terms directly. This comparison shows how the Noble Educators session model differs from other familiar online learning options.
| Provider | Pricing model shown | Format | Best fit |
|---|---|---|---|
Noble EducatorsNoble rate | $25 / session | 1-on-1 online AP Statistics tutoring | Families who want school-aligned AP Statistics support, conditions and calculator practice, and a clear per-session rate. |
Wyzant | Tutor-set rates | Tutor marketplace | Families who prefer to browse individual tutor profiles and available rates. |
Varsity Tutors | Plan-based pricing | Live tutoring and memberships | Families considering a larger tutoring package or membership model. |
Tutor.com | Subscription plans | On-demand tutoring | Students who need quick homework help across several subjects. |
Outschool | Class-specific pricing | Live and self-paced classes | Families looking for group classes as well as individual learning options. |
Khan Academy | Free self-guided practice | Videos and practice activities | Independent review, rather than recurring live 1-on-1 tutoring. |
Common challenges
AP Statistics asks students to choose the right procedure, check conditions, read calculator output, and explain what a result means. Focused tutoring makes the reasoning behind each response part more visible.
Tutors help students decide between a proportion or a mean, one or two samples, an interval or a test, and a chi-square or regression procedure before any calculation.
Lessons connect the Random, 10%, and Large Counts or Normal conditions to what the calculator output actually shows, so students can justify each step.
Lessons model the full sentence AP readers want: link the p-value or interval back to the parameter, the significance level, and the real-world question.
Some students need a patient review of data displays and probability before tackling inference. Others need help choosing a procedure, checking conditions, using the calculator, or strengthening free-response writing before an assessment. Noble Educators can match the enquiry to a tutor who fits the student's level, curriculum, and goal.
Meet our teachersParents can share a current unit, a data set, a released free-response question, calculator output, a recent score, or a teacher note before tutoring begins. That gives the tutor a practical starting point and helps each session focus on the AP Statistics skill that matters next.
See how it worksQuestions parents ask
Related tutoring
Compare related math support, tutor options, pricing, and the next steps behind a focused tutoring plan.
Share the student's grade, current AP Statistics focus, and what feels difficult. Noble Educators will help you choose the most useful next step.